Table of Contents
2 Analysts: DOGE and SHIB are at These Levels in the Coming Weeks!
The price of Dogecoin faced selling pressure as it pierced the support base of $0.230 to $0.212. According to analyst Akash Girimath, closing below $ 0.195 may reduce the DOGE price to $ 0.16. Investors can expect the meme coin to start a 100% uptrend after a jump to $0.16. The price of Shiba Inu (SHIB) is at a critical point as it approaches a major bull run.
The price of Dogecoin faced selling pressure as it pierced the support base of $0.230 to $0.212. According to analyst Akash Girimath, closing below $ 0.195 may reduce the DOGE price to $ 0.16. Investors can expect the meme coin to start a 100% uptrend after a jump to $0.16. The price of Shiba Inu (SHIB) is at a critical point as it approaches a major bull run. Analyst Sarah Tran says that SHIB bulls may have trouble below $ 0.00002879. In the continuation of the article, we are looking at next week's technical levels in both meme coins.
Dogecoin (DOGE) is looking for an opportunity to raise the price
Dogecoin price is in a slow and steady downtrend. However, this correction is retracing its recent gains and is close to turning a crucial support area into a resistance barrier. While the current outlook is bearish, this drop could initiate a much-needed bottom rebound and nearly double the value of DOGE.
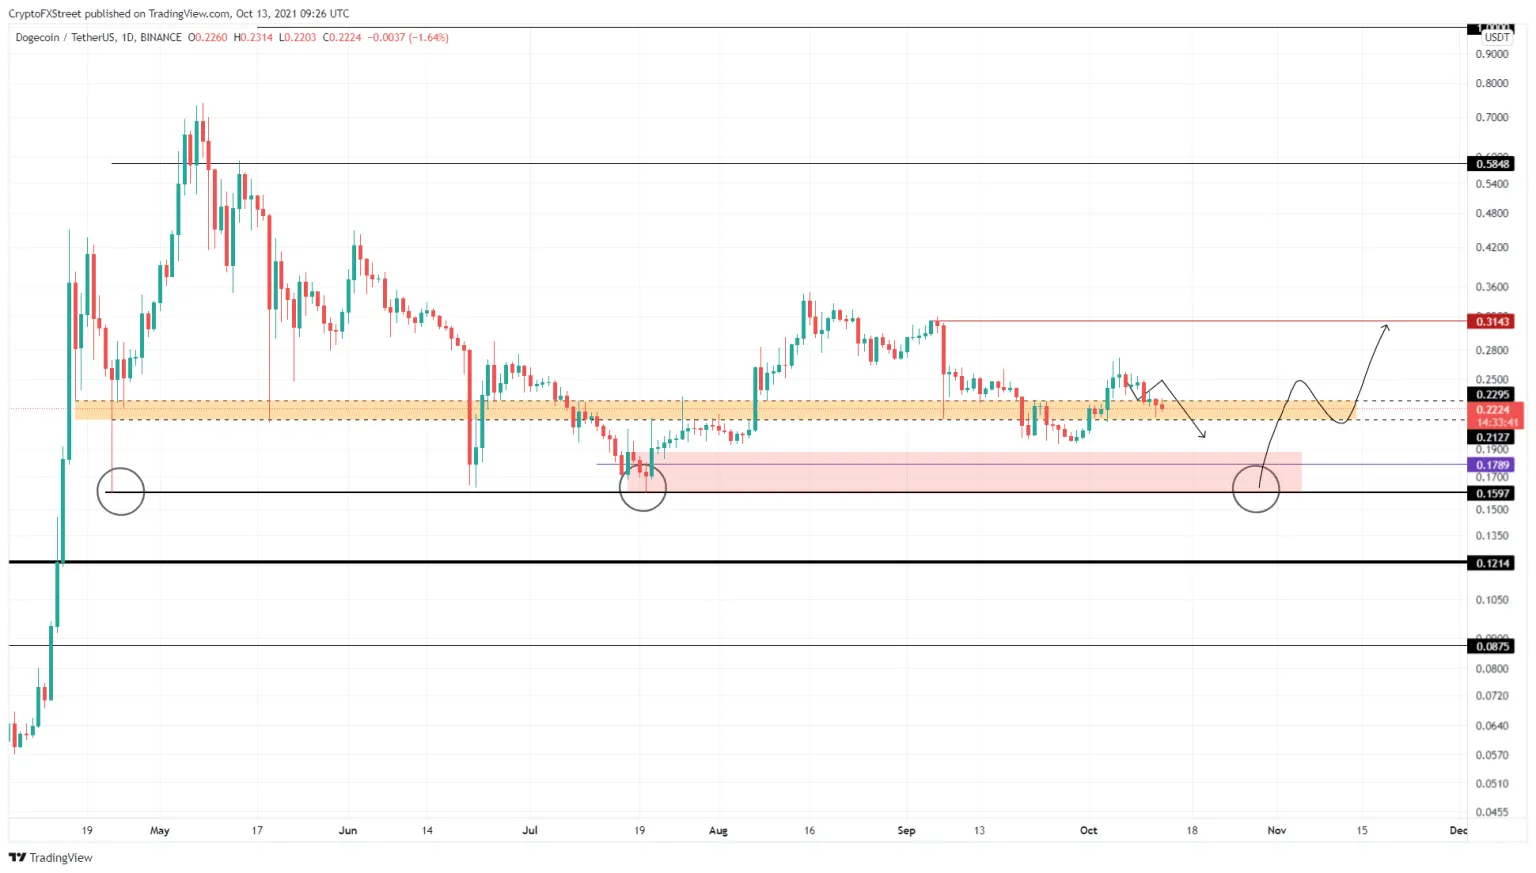
October September 28 to October 2, the price of Dogecoin increased by 38%, decoupling the resistance area from 0.212 to 0.230 dollars and turning the region into support. Although this is a bullish development, altcoin markets have started to see a decelerating interest among users as Bitcoin ETF rumors have started to circulate.
The capital returned from altcoins to BTC may be the factor that triggered the ongoing decline, which caused the Dogecoin price to correct 18% and is currently trading inside the aforementioned barrier. a definite close below $ 0.212 will indicate that the bulls have lost, according to the analyst, and there is a good chance of extending this pullback. In such a situation, the Dogecoin price will revisit the 0.195 dollar bottom level on September 29, when it has the opportunity to create a double bottom and reverse the decline. In addition to these, Dogecoin mining is also done, so there is a constant supply and demand.

Bears may seek these two supports on the downside
Failure to make a reversal here could drag DOGE price to a stable demand level of $0.1789 or $0.16. Here, Dogecoin price will form a triple bottom setup, signaling that a major uptrend awaits DOGE holders. Assuming a similar rally has begun, Dogecoin price could break through temporary hurdles and rally the remaining liquidity at $0.314, the September 6 high. This increase would coincide with a 97% rise from $0.160. On the other hand, if Dogecoin price fails to defend $0.16, things could turn bearish for the meme coin. Traders can expect a 25% drop to push DOGE to the nearest support level at $0.121. On the other hand, SHIB is preparing for another 45% rally after gaining more than 300% weekly…
Whales plundered Shiba Inu (SHIB)
The Shiba Inu price is consolidating with a high swing of $ 0.00003528 after its massive rally of over 340% at the beginning of October. SHIB presented a continuation model and is almost on the verge of a breaking point. If the Dogecoin killer manages to break above a critical resistance level, a rally of 42% can be expected, according to analyst Sarah Tran.
SHIB technical analysis
The Shiba Inu price creates a symmetrical triangle on the 4-hour chart, indicating that bulls can hold their breath after the huge uptrend. While SHIB confuses investors with directional signs, its next move could signal a 42% rise, depending on whether it gets above a critical hurdle or not. Investors should remember that the bullish target will be on the radar only if the Shiba Inu price rises above the upper limit of the triangle formation at $ 0.00003037. If only the SHIB manages to rise above the above-mentioned resistance, the current chart model reflects a 42% rise to $ 0.00004346, equivalent to a Fibonacci retracement level of 127.2%.
However, SHIB price may face a few hurdles before hitting the target
The first obstacle above the upper trend line of the triangle appears at the October 13 peak of $ 0.00003073. Additional obstacles may arise at the peak of October 11 and the peak of October 7, respectively, at 0.00003200 and 0.000003528 dollars. The Momentum Reversal Indicator (MRI) also presents a break-even line at $ 0.00003559, which indicates that this area will be crucial for breaking before the price of Shiba Inu (SHIB) climbs to the above-mentioned bullish target.
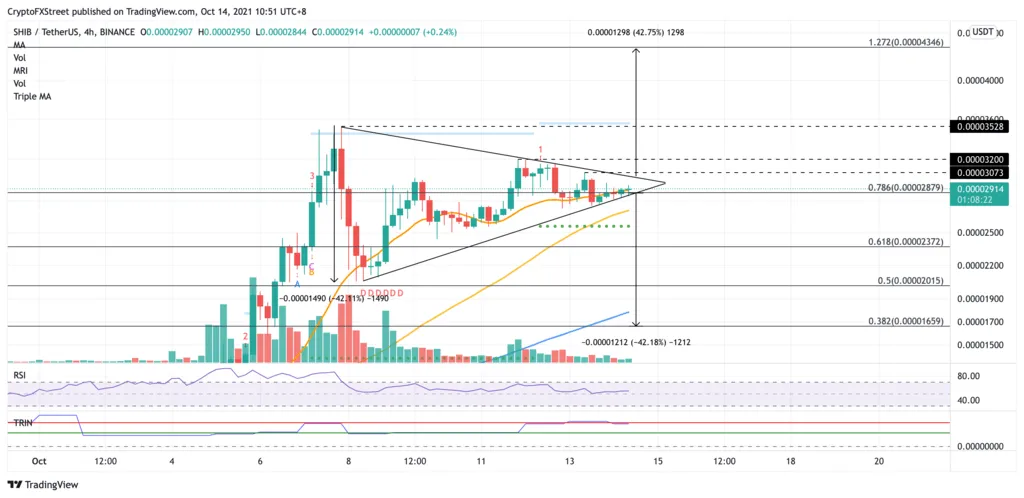
If the Shiba Inu faces an increase in sell orders, the SHIB could resort to the first line of defense of the 20 four-hour SMA at $0.00002879, which coincides with the 78.6% Fibonacci retracement level. Traders should also bear in mind that a slice below this level may risk a 42% drop to $0.00001659, which would coincide with the 28.2% Fibonacci retracement level given by the current pattern.
However, additional support may appear at the 50 four-hour SMA at $0.00002712, followed by the MRI-given support line at $0.00002562. Other lines of defense will emerge at $0.00002372, $0.00002015 and $0.00001784, the 61.8% Fibonacci retracement level, the 50% Fibonacci retracement level, and the 100 four-hour SMA.