Table of Contents
Cardano (ADA) price is preparing for a new explosion!
The price of the popular altcoin Cardano (ADA) made a definite exit from the falling parallel channel pattern on July 18 with a significant increase in volume activity. Earlier today, the post-retest rally showed 12% growth. This move allowed ADA price to retake the $0.5 resistance. However, sellers defending this level restrict buyers from claiming this level back.

Key points for ADA price:
- ADA price faces pressure at $0.5 resistance
- The slopes of the MACD indicator on the verge of entering a bullish theory support a break of $0.5.
- ADA's intraday trading volume is at $1.07 Billion, showing a 62.6% gain.
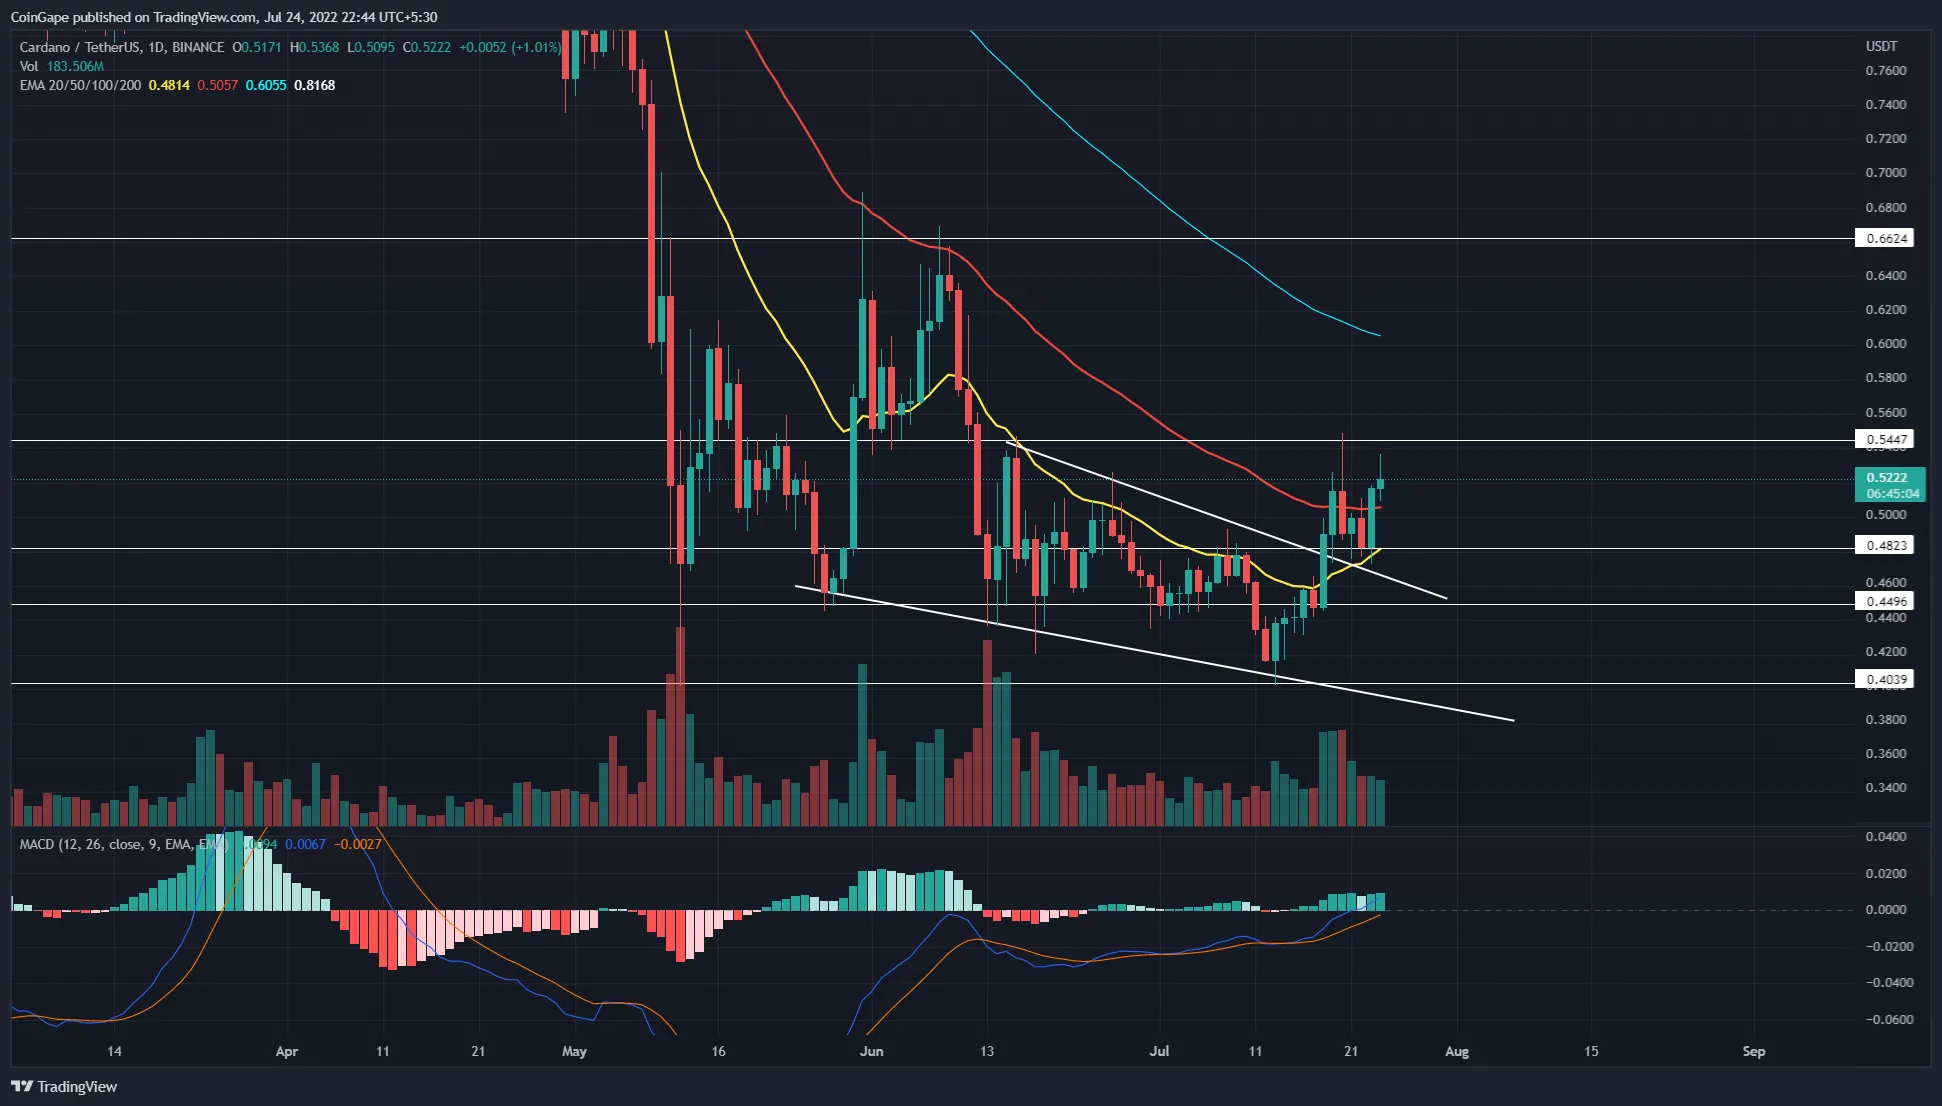
In response to the recent uncertainty in the crypto market, the ADA/USDT pair has been trying to exit a falling parallel channel for over a month. Also, under the influence of the pattern, the altcoin retested the May low of $0.4, confirming this level as support.
Since last week, market sentiment has improved, triggering a new recovery rally in ADA. According to the charts, on July 13, the coin price recovered from the $0.4 support and rose 32% to the $0.5 mark.
Also, the recovery rally in between gave an upside break out of the falling channel, showing that buyers are aiming to climb higher. However, the post-retest rally compares to $0.5 resistance. The high price rejection added to the daily candle indicates that supply pressure is intact.
Thus, a possible reversal could bring the altcoin price down to $0.482 and continue its sideways walk for a few more sessions. Conversely, if buyers weaken the selling pressure and hold the daily candle close above $0.5, the renewed bullish momentum could push ADA price 21.5% higher to $0.66.
Cardano Technical Indicator
MACD Indicator: The fast and slow lines mark the neckline of the neutral zone, offering a potential buy signal between crossovers. Also, the rising green bars on the histogram chart show sustained bullish momentum.
EMAs: Since the beginning of April, the 20 and 50-day EMAs have acted as dynamic resistance to ADA prices. However, the recent recovery has turned these resistances into viable support, helping buyers prolong this rally.
Resistance Levels: $0.54 and $0.66
Support Levels: $0.482 and $0.45