Table of Contents
Polkadot (DOT) Technical Analysis
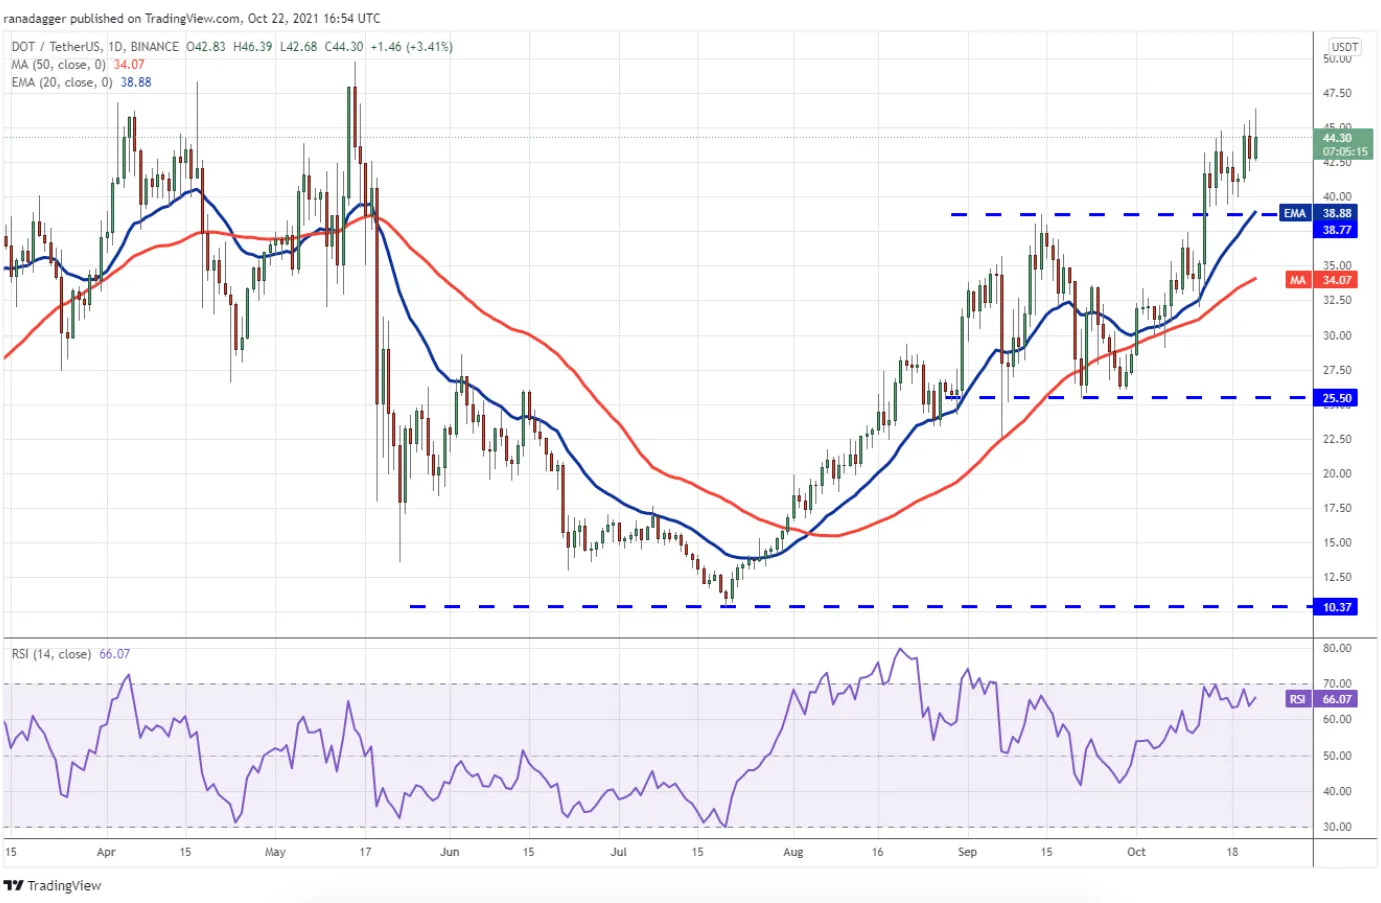
Polkadot (DOT) price climbed above the $44.78 resistance on Oct. 20, signaling a possible resumption of the upward move.

Polkadot (DOT) price climbed above the $44.78 resistance on Oct. 20, signaling a possible resumption of the upward move. The bears tried to trap the aggressive bulls by pulling the price to the breakout level at $39.02 on Oct. 21, but buyers had other plans. On the technical side, the rising 20-day EMA ($38.88) and the RSI near the overbought zone suggest the bulls have prevailed. If buyers hold the price above $45, DOT could retest the ATH level of $49.78. At this level, the bears could pose a hard hurdle, but if the bulls do not give up, the DOT price could continue its upward move to $53.90. The bears will have to push the price below the breakout level of $38.77 to turn the advantage in their favor. In this direction, DOT price could decline to $34.07.