Table of Contents
Bitcoin (BTC) Technical Analysis
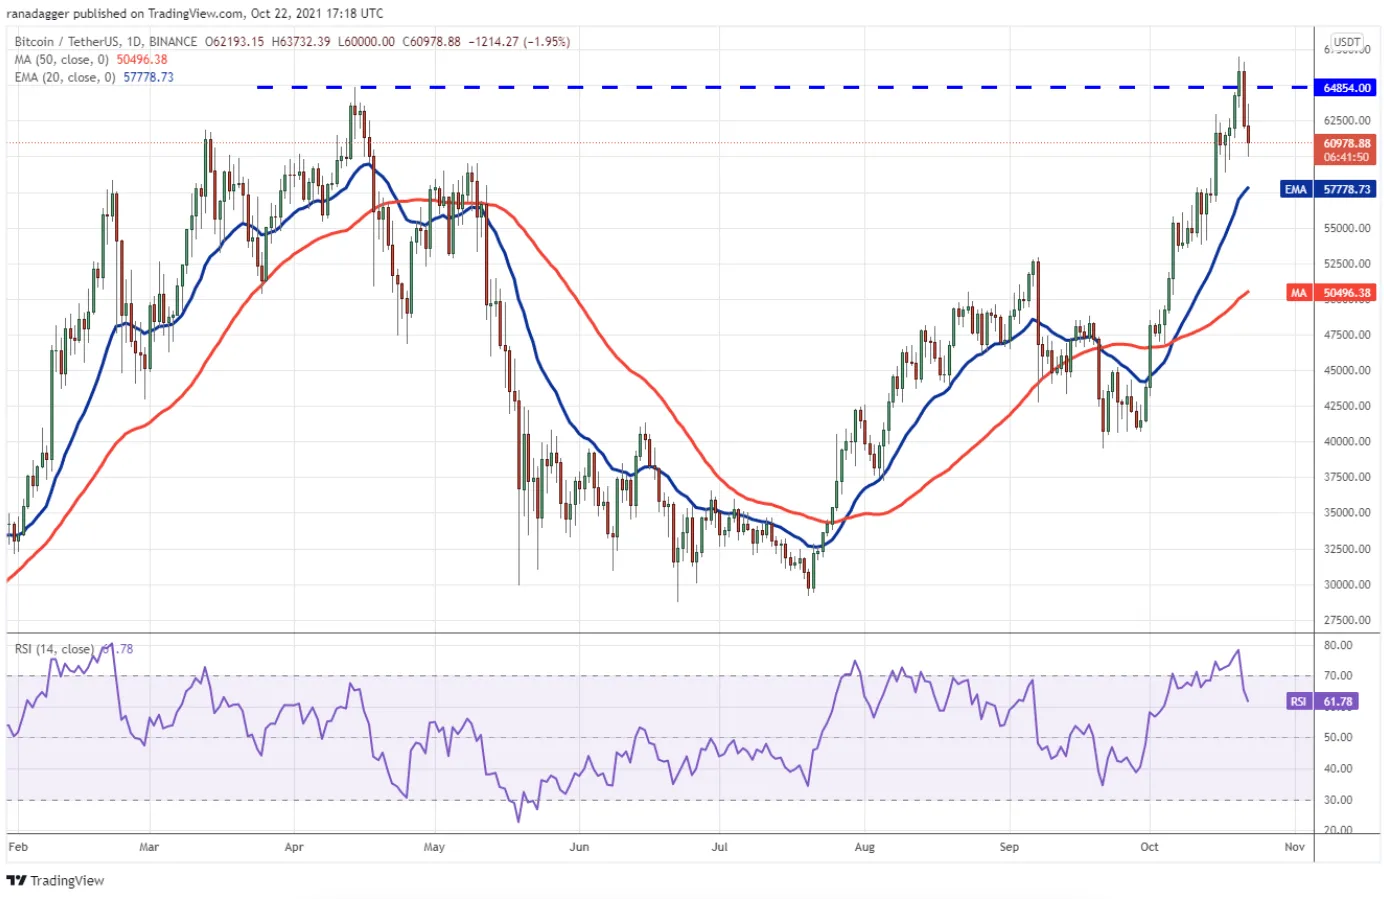
Bitcoin (BTC) price peaked with the dollar on October 20, but the bulls were unable to sustain the breakout as bears pulled the price below the breakout level of $64,854 on October 21.

Bitcoin (BTC) price peaked with the dollar on October 20, but the bulls were unable to sustain the breakout as bears pulled the price below the breakout level of $64,854 on October 21. This shows that the sellers are trying to trap the aggressive bulls. The bears tried to recover on October 22, but today's long wick candles show that traders are selling on small rallies. Strong support to watch on the downside is $57,778 at the 20-day EMA. If the price bounces back from this support, it will indicate that the sentiment is positive and that traders are buying on the dips. This will increase the likelihood of a break above the overhead resistance zone between $64,854 and $67,000. According to the analyst, the BTC price could rise to $75,000 later. On the other hand, if the price drops below the 20-day EMA, selling could accelerate and BTC price could drop to the 50-day SMA at $50,496.